Taming Node Not Ready: A Three-Layer Kubernetes Stability Optimization
Background
After a full migration from Azure AKS to a new cloud provider's managed Kubernetes, a series of stability problems started surfacing. The migration itself delivered a massive cost win — roughly the same workload now runs at about 30% of the original infrastructure cost — but the trade-off was operational complexity and a noticeably less mature managed-K8s experience. This post is a retrospective of how we worked through those problems across three layers: infrastructure, application, and observability.
Problem 1: Delayed Custom Labels on Node Provisioning
When creating a new node pool or scaling one up, our custom agentpool label took a noticeable delay to appear on the new nodes. Because our workload scheduling depends on that label, scale-up effectively didn't take effect within that window.
A manual workaround existed — patching the label from the control plane with kubectl — but this was strictly a provider-side issue. On Azure, the label was guaranteed to exist by the time the node reached Ready. The right fix had to come from the cloud provider, not from us reaching into the control plane.
I opened a support ticket. The root cause turned out to be a cron-based batch tagging job on their side. After their fix, label propagation is now effectively real-time.
Takeaway: When the abstraction below you is doing the wrong thing, don't paper over it from above. Push the fix down to where it belongs.
Problem 2: Worker Nodes Going Not Ready
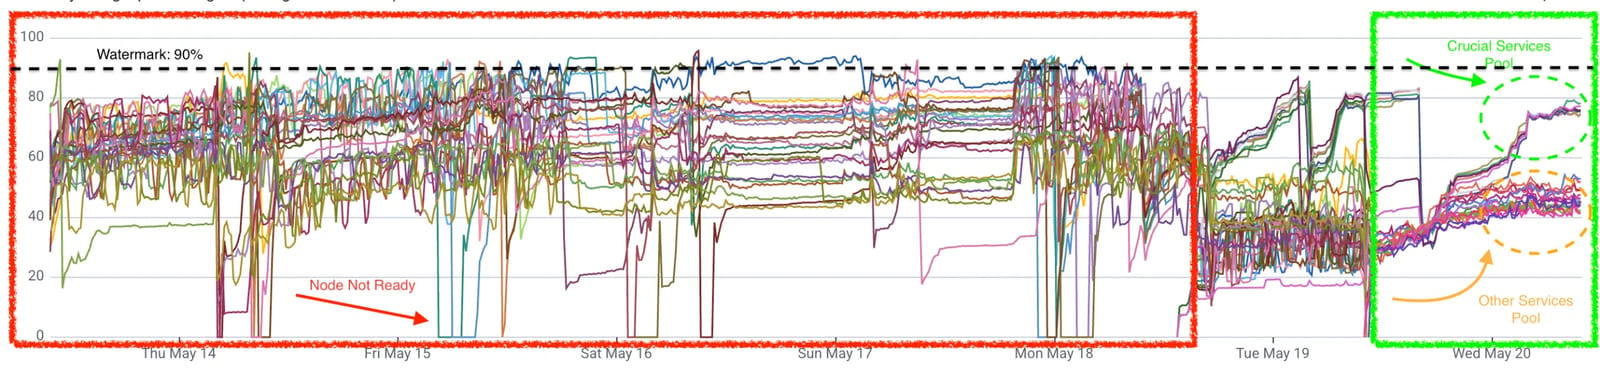
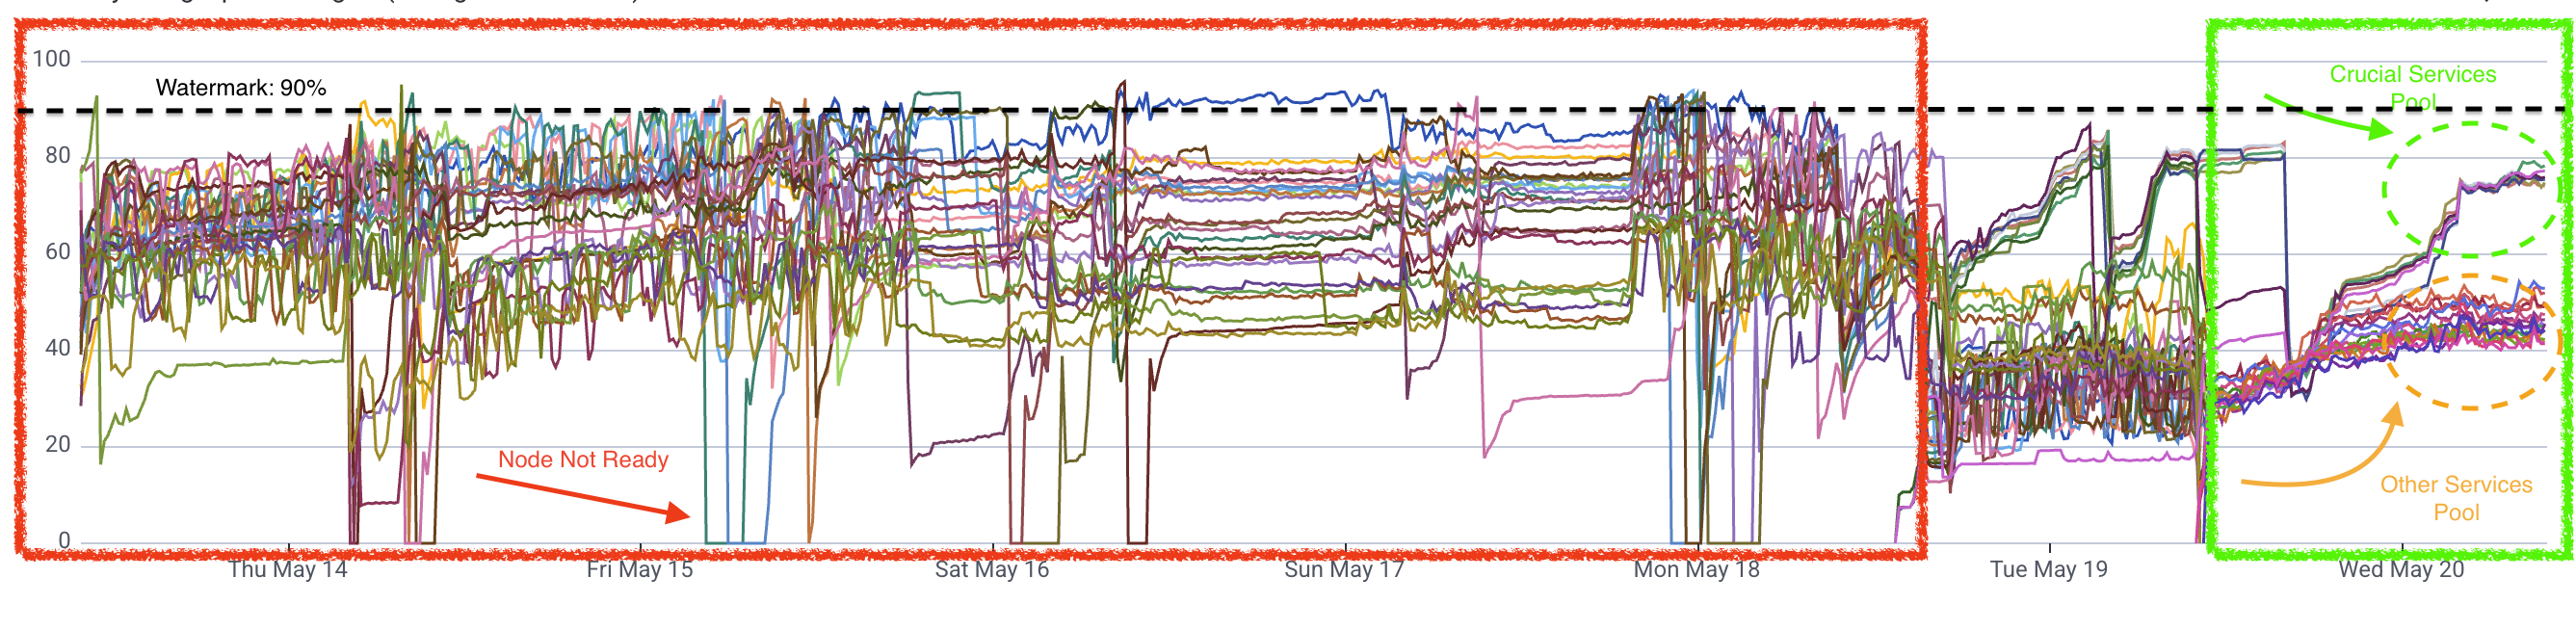
This was the serious one. Worker nodes were randomly transitioning to NotReady, getting tainted, and in the worst cases taking down crucial services — a P1 incident.
The pattern had existed for a while. Earlier, the workaround was simply restarting the affected node, and because business development pressure was high and the issue was infrequent, it stayed parked. But as traffic grew, the frequency grew with it. Treating it as P1 was overdue.
Hypothesis: Memory Pressure on the Host
The most likely cause was clear early on: when a worker node ended up scheduling multiple memory-heavy services, total host memory usage would spike until there was no headroom left. At that point, kubelet could no longer send heartbeats, or critical processes like the container runtime got killed by the OOM killer. The node went NotReady, taints were applied, and recovery required a restart.
I could SSH into a node and tune kubelet config directly, but I shouldn't — that's provider-side territory. The fix needed to come from how we used the cluster, not from reaching past the managed boundary.
Fix 1: Node Affinity for Stateful Services
The first change was adding node affinity rules to high-memory services so that any single node hosts at most one replica of a critical stateful service. The cost: we now need at least replicas nodes for these workloads. Horizontal scale is bounded by node count.
This was an acceptable trade-off because:
It only applied to stateful services. Stateless service scaling was unaffected.
Stateful service scaling already requires upfront capacity planning, so the constraint matched how we operate anyway.
Fix 2: Split the Single Worker Pool into Tiers
The migration had been time-pressured, and one shortcut was carrying the original single worker-pool topology forward without revisiting the VM specs. Going back to do proper performance testing surfaced something we'd missed: we were on shared-CPU VMs, which was quietly capping app performance.
While this wasn't a direct cause of NotReady, fixing it gave us a chance to restructure the pools properly. The new layout:
Core pool — dedicated CPU, stronger VM spec. Hosts crucial services.
Shared pool — original shared-CPU spec. Hosts everything else. Performance is still plenty for these workloads.
This let us put the right workloads on the right hardware instead of letting the scheduler mix them.
Fix 3: Application-Side Optimization
In parallel, a colleague focused on the application layer. Two notable findings:
A memory leak from closure capture in one of the Kotlin services. The functional-programming style had quietly built up unreleased references over time — the kind of leak that doesn't show up in unit tests and only manifests under sustained production load.
Kafka Streams tuning for crucial services — primarily RocksDB compaction strategy and memory allocation, paired with guaranteeing the resources on the K8s side.
Cost Outcome
The initial estimate for the new pool topology was a 30–40% infrastructure cost increase. Given the underlying migration had already cut infra costs to roughly a third of the previous platform's, this was acceptable.
But the performance testing changed the math. The new VM specs delivered enough headroom that we could:
Scale replica counts down by roughly half for many services
Reduce the number of mounted volumes accordingly
Scale down the shared pool too, since the application-side memory optimizations alone freed up hundreds of GBs
The shared pool wasn't scaled all the way down — it was held at a node count matching the replicas of its memory-heavy tenants, to keep distribution balanced.
Final cost delta: roughly +10%, with room to go lower if we accept reduced redundancy.
Observability Layer
Stability work isn't done until you can see the failure modes before they bite. We added cluster-level metrics with two alerts that map directly to the failure modes above:
Node
NotReady— alerts the moment a node transitions.Node memory utilization > 90% — early warning before the OOM cascade.
These exist because we now know exactly which symptoms predict the incidents we used to chase after the fact.
Result
After the changes settled:
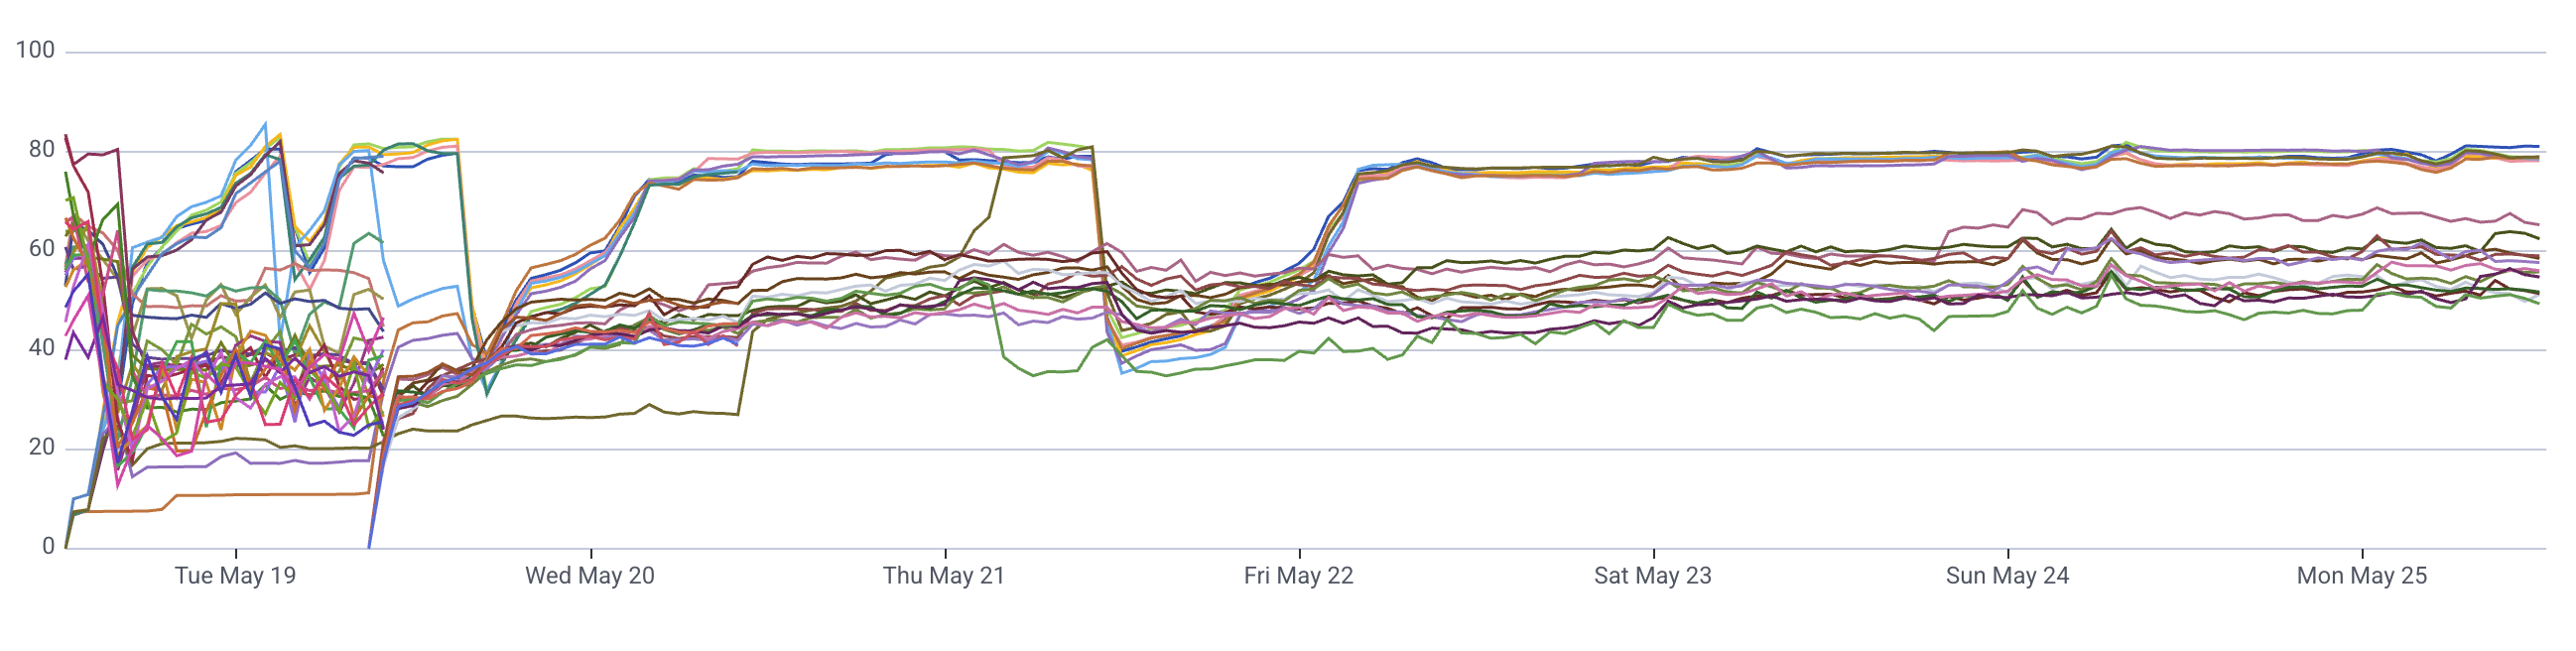
Core pool peak memory usage holds around 80%, with 2 nodes held as backup capacity.
Shared pool sits around 40%.
The memory utilization chart over the past week is essentially smooth — no spikes, no jagged edges.
Reflection
The thing that worked here was treating the problem on three layers rather than just one:
Infrastructure — right-sized VMs, the correct pool topology, affinity rules that match how the services actually behave.
Application — fixing the leaks and tuning the parts of the stack that were consuming more than their fair share.
Observability — closing the loop so the next incident gets caught early, not in a postmortem.
Any one of these layers alone would have produced a partial fix. Affinity rules without app-side memory fixes would have hidden the leak behind extra hardware. App-side optimization without pool restructuring would have left us on the wrong VMs. Observability without the structural fixes would have just given us a louder alarm for the same incident.
The other lesson is about pushing problems down the stack. The label-delay issue belonged to the provider. The kubelet config belonged to the provider. The instinct to reach across the managed boundary and "just fix it" is almost always wrong — the right move is to fix what's yours, push the rest to the layer that owns it, and design around what you can't change.